Which way the wind blows…

In the song Subterranean Homesick Blues, Bob Dylan rasped (some say rapped) “you don’t need a weatherman to know which way the wind blows”.  That’s true enough, but you might want one to tell you why it blows the way it does, and that’s what I’m going to attempt here.  You may recall from the last post a discussion of climate indices and their interactions on influencing weather in the tropics.   We will divert our focus poleward here and talk about the relationships between climate indices and the weather in the mid-latitudes, or the regions of the world where many of the key global crops are grown.  We will start with the jet stream, a constantly moving river of air some 4-7 miles above the earth’s surface.  The jet stream is a manifestation of the ‘battleground” where cold/dry polar air meets warm/moist tropical air in a Sisyphean attempt to equalize the temperature contrast between the equator and the poles.

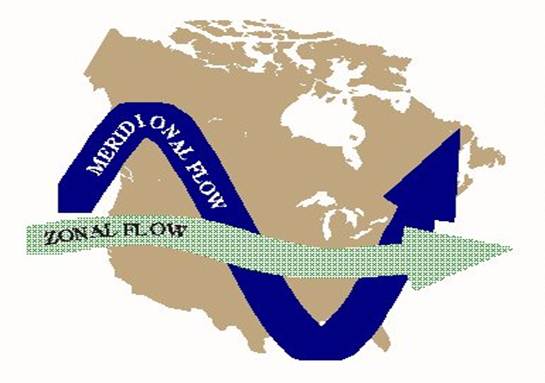
As a  crude approximation, the jet stream flow is described as being either zonal or meridional.  Zonal flow (see picture) is predominantly west-to-east flow and is often called “flat” flow.   It methodically marches the energy  of the jet stream and its attendant storms at a regular pace, and thus brings alternating periods of storminess and clear weather.  A common feature of zonal flow is that no one particular aspect of the weather remains static in one place over an extended period of time, avoiding the extremes that often plague agricultural production.  By contrast, meridional flow (also see picture) has a more pronounced north to south component of the flow, and is often associated with persistent blocking of the jet stream flow, resulting in strong ridges of high pressure and deep troughs of low pressure.  These patterns may also be transitory  and when they are they result in wild swings of weather or they may become stationary, and unleash a period of persistent weather….be it drought, floods, heat waves or cold snaps.  This type of pattern, a persistent meridional flow, are the enemies of crops in the mid-latitudes, most recently as evidenced by the US Midwest drought of 2012.

So, the goal is to look for patterns in the myriad of global climate indices….in sea-surface temperatures , global circulation patterns, solar outputs….for clues as to the predictability of zonal (more crop friendly) and meridional (more crop unfriendly) flow regimes.  And there are a few suggestions to be found there.   In the last post we discussed the role the PDO (Pacific Decadal Oscillation), its 20/60 year periodicities and how it has shifted to negative PDO (see below).

Monthly Values for the PDO index, 1900-2012

To that, we will add the AMO (yes, the Atlantic Multi-Decadal Oscillation, not to be outdone).   The predominant periodicity of the AMO, shown above, is 60-80 years.   Before we get too carried away, keep in mind we are working with limited datasets and our understanding of these indices is incomplete.  Nonetheless, a review of the charts below show that during periods of negative PDO and positive AMO ( for instance the mid 1930’s, the 1950’s and the last few years) were periods when significant disruptions to climate and food production occurred globally and especially in the US.   

We these days find ourselves bombarded with popular press stories about runaway warming and tipping points in climate, yet a chart of US corn yield deviation from trend shows that the frequency of highly variable yields was greater in the period around the 1970’s than in the 1990’s, punctuated by the drought of 2012.   So, the working hypothesis here is that the period of generally benign weather for mid-latitude agriculture has come to an end as the climate system shifts gears and in doing so will promote on average a greater frequency of meridional flow, resulting in droughts, floods, heat waves and cold snaps.  Embedded in that last statement is the length of the growing season, which has slowly been increasing and providing very favorable conditions for agriculture…all under an extended regime of zonal flow.  Meridional flow will also increase the possibility of early and late frosts, and begin to take away those extra growing season days gained over the last few decades.

Since 2010, a major crop failure has hit in three different regions of the world every year.  In 2010, it was a phenomenal drought over Kazakhstan/Ukraine and neighboring areas.  In 2011, it was Argentina and southern Brazil (note that weather disruptions in SA prior to the late 1990’s would not have impacted global food production significantly, yet now it will, another new wild card).  And this year, the US Midwest.   Despite that, this is not meant to predict a disaster every year, that is not consistent with the historical record.  But they will become more frequent, and the volatility in global commodity markets will continue.   Now more than ever, risk management expertise and discipline will be required.  Are you and your organization prepared?


Pacific Decadal Oscillation

Climate and its ultimate offspring, the weather, remain one the most important, contentious and in my opinion mis-represented features of the global landscape.  The great drought of 2012 reminds us of that.  Sure, geo-political and macro-economic events are almost always more press-worthy, but climate and weather are always there, always in motion and always working to deliver a unique combination of variables that remains just out of the grasp of researchers today.  Lest you think I am disparaging climate research, far from it.   But I believe it is best to characterize it as several steps forward followed by several steps backward, which is to say that the answer to one question almost always generates another or several more questions.  That is the power and beauty of science!   But climate science has made outstanding leaps in the past 50 years, not in the least because of the advent of satellites and the capabilities to collect a more robust spectrum of data from around the globe, especially the oceans.  ENSO (El Nino/Southern Oscillation) makes regular headlines these days, but back in the late 1970’s it was strictly a topic for academic researchers.  1982/83 changed all that and brought ENSO to the forefront.    Historical data and climate models now show relationships between ENSO (climate) and weather.  But they are, as are all attempts at modeling the atmosphere, imperfect….which reminds me of one of my favorite quotes….”Every theory of the course of events in nature is necessarily based on some simplification of the phenomena and is to some extent therefore a fairy tale” – Sir Napier Shaw: Manual of Meteorology: I, 123.  

Image courtesy of the University of Washington

So where I am going with this?  Simply enough, I want to remind people that, despite what you hear in the press almost every day, much much less is known about the climate system than you are told to believe.  It is human arrogance that leads us to believe with perhaps a few hundred years of global land data, a half century of satellite data, and limited ice cores and tree rings from millenia, that we really understand what is going on in the climate system.  Case in point today is with the Pacific Decadal Oscillation (PDO).

The PDO is sea surface temperature dipole in the North Pacific, of which records go back to just over 100 years ago (in other words, insignificant in the climate history of planet Earth).  But as stated above, we are continuing to learn how these medium to long term climate oscillations interact with shorter term climate oscillations (ENSO) and a myriad of other variables the ultimately govern the winds on this planet.  As a slight detour, here are some other climate indices:    AMO (Atlantic Multi-decadal Oscillation), IDO (Indian Dipole Index), AO/NAM (Arctic Oscillation/Northern Annular Mode), NAO (North Atlantic Oscillation), SAM (Southern Annular Mode), QBO (Quasi-biennal Oscillation), Solar Flux/Sunspots, etc.  Complex indeed.

But back to the PDO.  It has multiple periodicities of approximately 20 and 60 years, which are incompletely understood.  But we can surmise that a positive PDO (left picture) has on average a greater abundance of warm water in the tropical Pacific to support El Nino’s and that as such they will be more frequent and more intense on average in the phase.  The converse is true of the negative phase.  On average cooler waters will support less frequent and intense El Nino events, and more frequent and intense La Nina events.  Why do we care about this?

Because El Nino/La Nina have differential impacts on the global weather.  Despite the localized devastation that El Nino wreaks, in general La Nina tends to be more damaging to global agriculture, and we are entering a period of the negative phase (recall 20 and 60 year periodicities, so we are here for a while) and will on average tend to have a greater risk of threats to agriculture than not.  Also note a warm tropical Pacific, given its expansive reach, also generally warms the planet.   The extended growing seasons, the almost unbelievable run of the Indian Monsoon in the last 25 years (much fewer failures than before), and the relative absence of crippling US droughts in the same time frame…until this year…should remind us that the last several decades have seen less climatic disruptions in key areas than prior periods.

Thus, the high prices and more importantly the extreme price volatility will remain a feature of these markets, and more so than ever will demand an integrated disciplined approach to managing risk, from farm-gate to table.   If you don’t know, understand and manage your risk, then without a doubt the market will do it for you.  It is not a sufficient strategy to hope for good weather.  The grain markets of 2012 have spoken, and in fact are not done speaking, but the real question is ,who is listening?